
I’d like to share openQCM Quartz Crystal Microbalance frequency behaviour in contact with water solutions at different weight percent of sucrose.
This is a very simple but effective experiment. First of all it is really safe! The experiment does not require any dangerous chemical compound, we need just water and common sugar, which is also known as sucrose. I believe it is very appropriate in the field of education.
In addition, it is an easy experiment for testing the right performances of a QCM in liquid environment. If everything is ok one has to measure a frequency variation which is proportional to the sucrose mass percent.
Water dissolves sucrose, which means that sucrose molecules in solid phase are separated by water molecules creating a homogeneous liquid solution. The water – sucrose solution shows different density and viscosity depending on the weight percent of sucrose. So one can measure openQCM frequency variation corresponding to water solution at different sucrose mass percent. The expected result should be that the frequency decrease is directly related to the sucrose concentration: the higher is the sucrose weight percent the higher should be the frequency decrease.
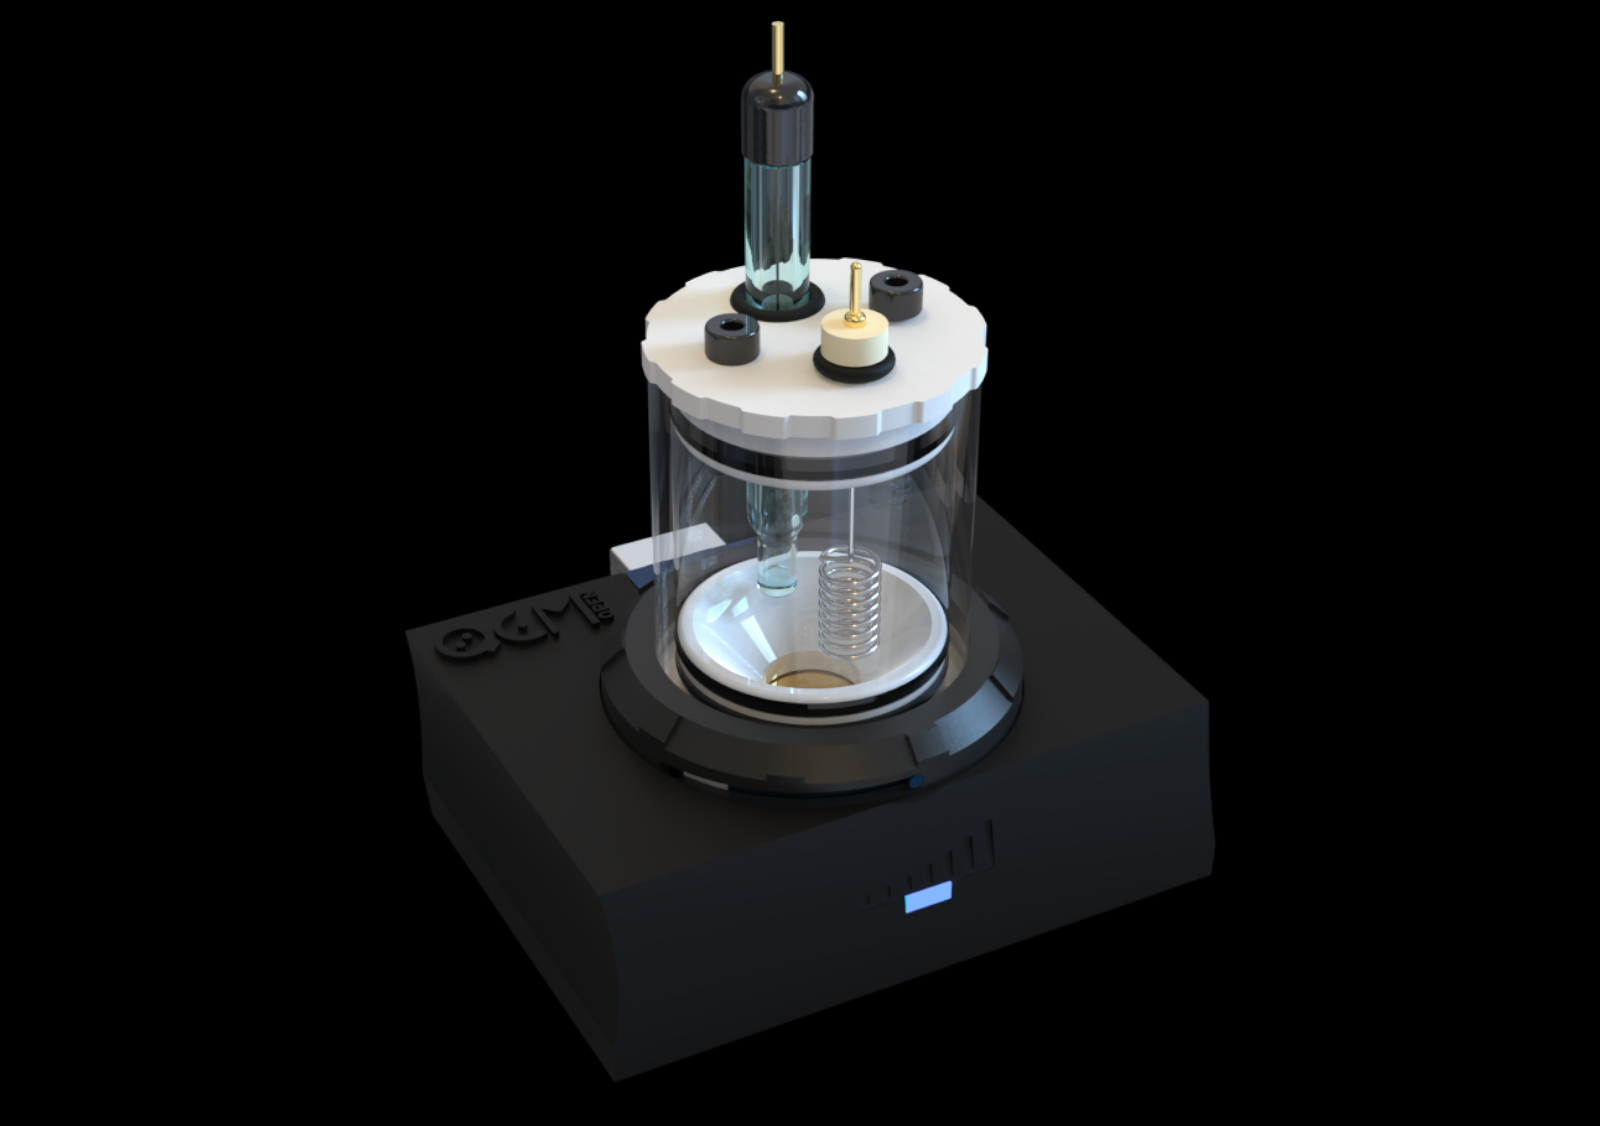
Let’s talk about the procedure we used in this experiment. We prepared 3 solutions at different sucrose weight percent 7.5% 15% and 30%. We used a peristaltic pump for injecting the different solutions in the measurement chamber. We have pumped the solution from a reservoir until we were quite sure that the chamber was entirely filled with the new solution. Then we have turned off the pump and we measured the openQCM frequency variation at the steady state. So the frequency measurement is performed at the equilibrium in static liquid conditions.
You should consider that is very important to wash the chamber with pure water between successive sucrose injections. Indeed what one measures in this kind of experiments are the frequency variations caused by:
- Mass changing due to the molecules attaching/detaching process at the crystal surface
- Density and viscosity changing of liquid sample.
Since the two effects can not be decoupled it is necessary to wash the quartz crystal measurement chamber before each new injection. In this way it is possible to compare the frequency shift caused by solutions with different sucrose concentrations.
The openQCM frequency signal during all the experiment using water solution with different sucrose concentration is shown in Figure 1.
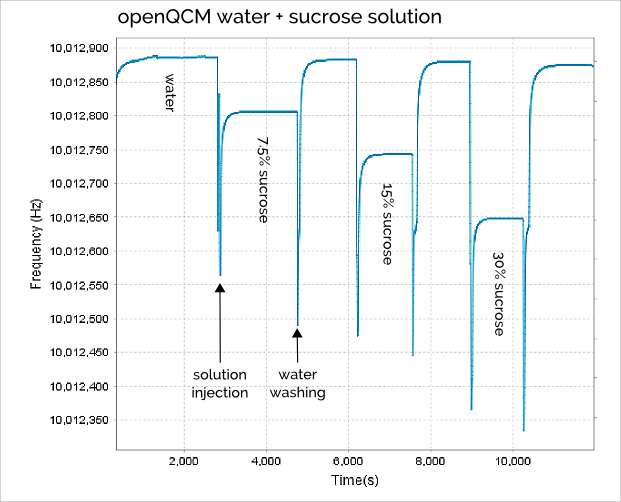
The “spike” in the frequency signal is mainly caused by the sudden pressure variation on the quartz crystal surface due to liquid injection process. But it is a transitory phenomenon and we don’t care about that.
It is very interesting to note that the water washing process is very effective because the quartz crystal frequency returns about to the same value every time we washed the chamber with pure water (roughly 10,012,880 Hz with a confidence of ± 5Hz). So the pure water frequency can be considered as reference throughout the experiment.
In Table 1 is shown the openQCM frequency measured for 3 water – sucrose solutions at different weight percent, it is also calculated the corresponding frequency decrease respect to pure water.
| Solution | Weight (%) | Frequency (Hz) | SD (Hz) | Shift (Hz) |
| Water | 0 | 10012886.3 | 0.5 | 0 |
| Sucrose 7.5% | 7.5 | 10012806.0 | 0.4 | 80.3 |
| Sucrose 15% | 15.0 | 10012743.0 | 0.4 | 143.3 |
| Sucrose 30% | 30.0 | 10012648.3 | 0.3 | 238.0 |
Table 1 Steady-state openQCM quartz crystal frequency for pure water and water-sucrose solutions at weight percentage of 7.5%, 15% and 30%. The frequency shift is calculated taking the pure water frequency as reference.
The frequency decrease vs sucrose weight percent data and the linear fit are shown in Figure 2. The experimental data are consistent with the predicted linear behavior, the frequency decrease is found to be proportional to the weight percent of sucrose.
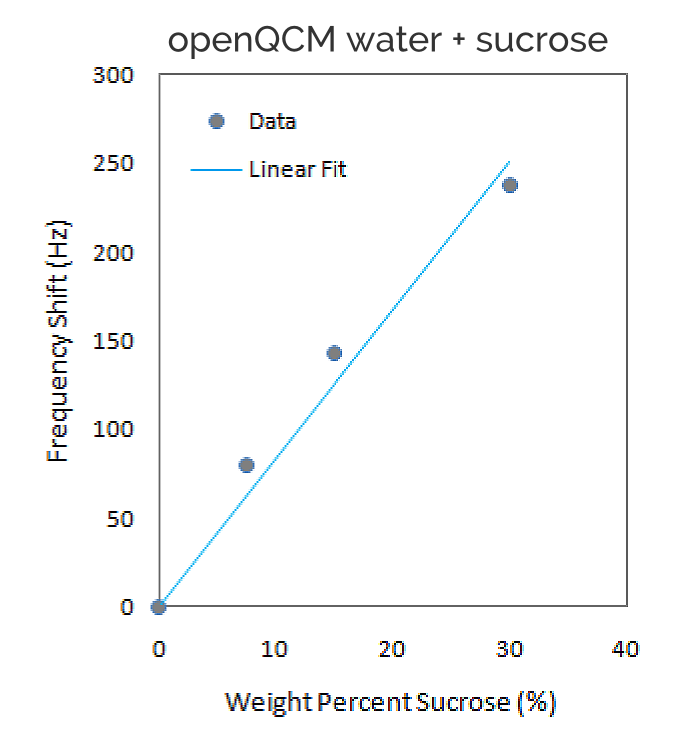
The goodness of linear fit for experimental data set is measured using R-squared, which is a statistical measure of how close the experimental data are to the fitted regression line. The statistical measures of R-squared is equal to 0.973, which confirms that the linear model is well suited to fit experimental data.
Conclusions
We have measured the openQCM frequency decrease caused by 3 solutions of water – sucrose at different sucrose weight percent (0%, 7.5%, 15% and 30%) using a 10 MHz quartz crystal. openQCM measurement chamber is designed so that only one side of the crystal with gold electrode is exposed to the liquid. The frequency decrease is due to both change in density – viscosity of the solutions and mass change caused by molecules adsorption on the quartz crystal surface. As expected the frequency decrease is proportional to the weight percent of sucrose demonstrating the openQCM analytical capabilities in liquid environment.
…and more
The raw data are open and available at this link
openQCM data visualization and processing software is free and available as zip folder at this link (note: it only runs on java JRE 8).
Acknowledgments
Great thanks to prof. Vojtech Svoboda, visiting Professor at Georgia Institute of Technology, for suggesting the experimental test with water – sucrose and for sharing his great expertise in the field of QCM technology.