The new openQCM Q-1 Python Software: real-time monitoring of frequency and dissipation variations of a Quartz Crystal Microbalance through the analysis of the resonance curve
Hello, everybody! I’m Vittorio Laguzza, an electronic engineer of the openQCM team and, from today, with a series of post on this blog, I will introduce you to the new Python software for the openQCM Q-1 device. I hope that these posts can be interesting and for further information, you can reply with a message under the post or contact me at laguzza@novaetech.com
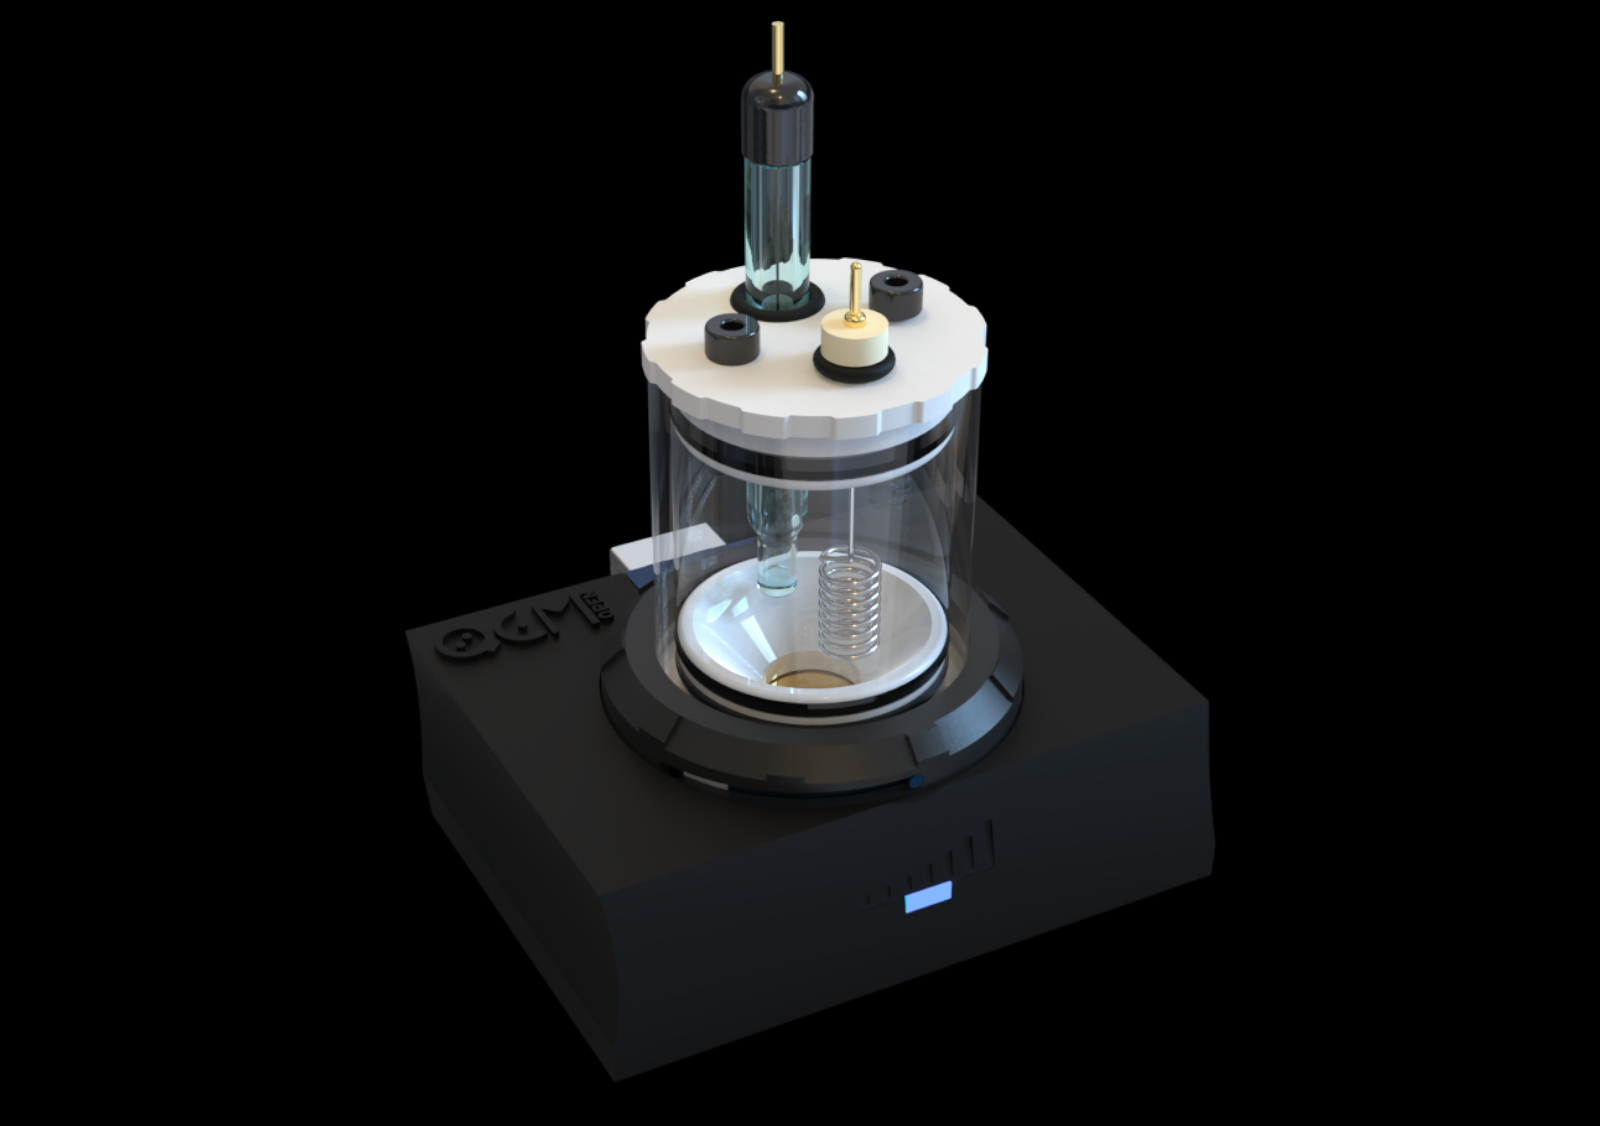
In this post, the diagram of the real-time data acquisition and processing cycle that describes the structure of our new software that controls the openQCM Q-1 Quartz Crystal Microbalance with dissipation monitoring is presented: an open-source package written in Python programming language (https://www.python.org), to display, process and store data in real-time from the openQCM Q-1 Device.
(For more information, visit our site https://openqcm.com/about-openqcm-q-1 or refer to the user guide https://openqcm.com/shared/q-1/openQCM_Q-1-userguide-v2.0.pdf, you can download the software at this link https://openqcm.com/shared/q-1/openQCM_Q-1_py_v2.0.zip)
The main functionality of the Python software is the real-time monitoring of frequency and dissipation variations (including temperature monitoring) of a quartz crystal microbalance through the analysis of the resonance curve.
The application performs some main processing (e.g. filtering, baseline correction, peak detection, calibration) before obtaining and displaying results (frequency/dissipation evaluation and monitoring and also temperature monitoring) or saving data. The software has a modular design, with a separation among its different functionalities (e.g. communication and visualization code, etc.), making it easy to add new signal processing tasks, use also different communication protocols, and customize the user interface for specific needs of the application.
The software package has a multi-process architecture, based on the multiprocessing Python Standard library (https://docs.python.org/3/library/multiprocessing.html) that allows to take advantage of multiple cores and to be able to handle data rates typically encountered during the acquisition and processing of the real-time signals.
Each module of the software architecture will be presented and described in the later posts.

The data cycle consists of the following phases:
– Real-time data acquisition
– Data pre-processing
– Data processing and analysis
– Results Description
Analyzing the identified phases and the data processing cycle, we can see that the described process is consistent with Knowledge Discovery in Databases. KDD is the process of discovering and acquiring useful knowledge from a collection of data. This data mining technique is a process that includes data preparation and selection, data cleansing, incorporating prior knowledge of data sets and interpreting accurate solutions from the observed results.
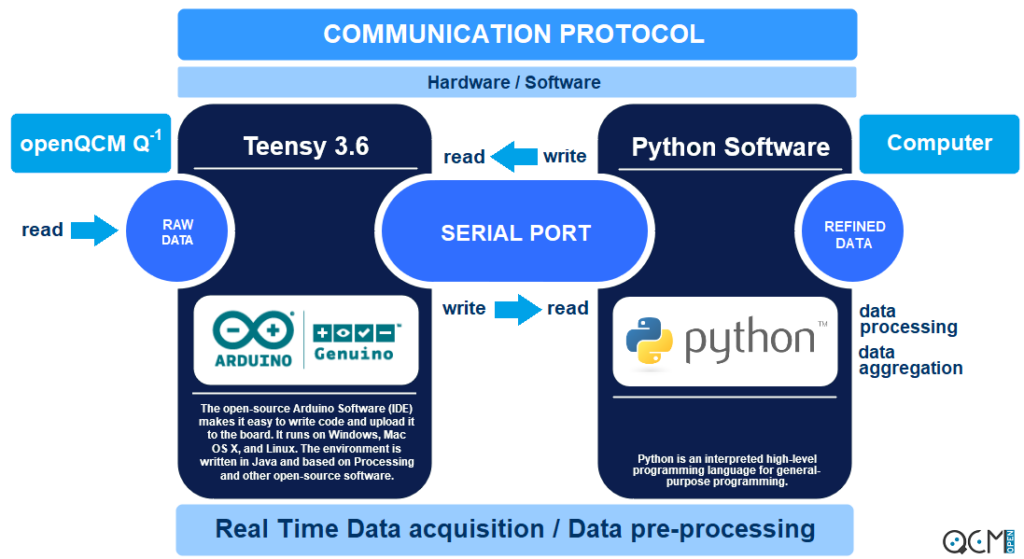
The first two steps, Real-time data acquisition and Data pre-processing, involve both the hardware and the software as they allow the communication protocol between the heart of the openQCM Q-1 device, Teensy 3.6 Development board (https://www.pjrc.com/teensy/techspecs.html) and our software. The communication protocol (a common subsection to both first two steps, see figure below) works through the dialogue between the firmware of the Teensy board and the serial communication package (PySerial Python external library – https://pypi.org/project/pyserial/) integrated into our Python software.
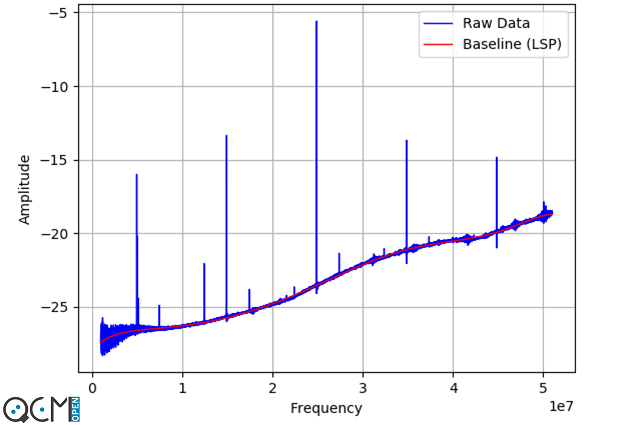
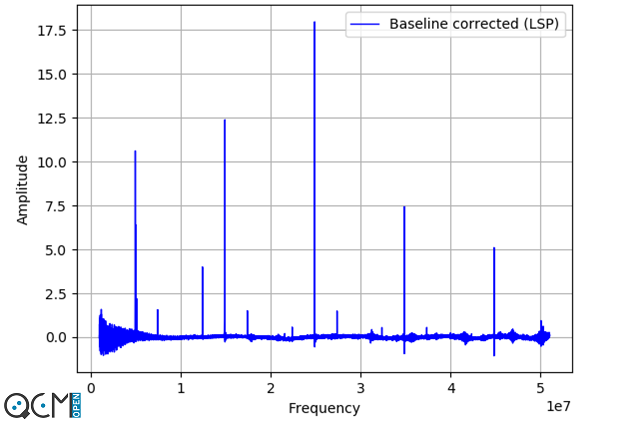
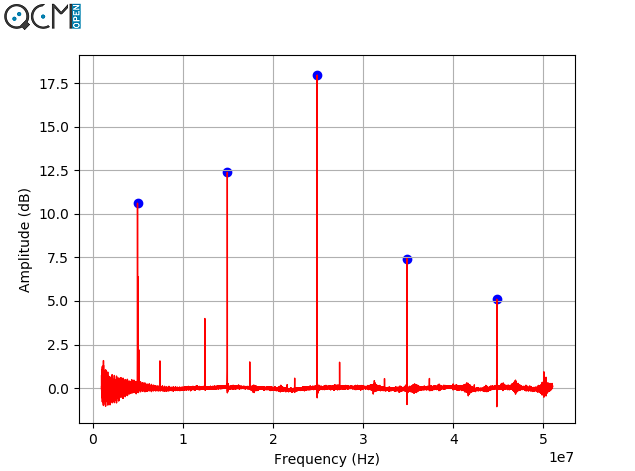
The other two steps, Data processing and analysis and Results description involve only the software. Device calibration (a subsection of Data processing and analysis) includes baseline estimation and correction, peak detection and data storage (including baseline corrected and peak detected). The figure below shows the device calibration section.
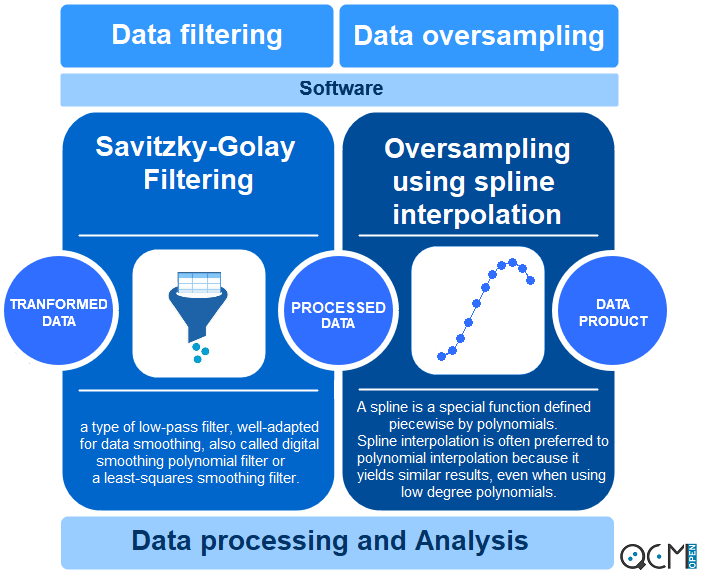
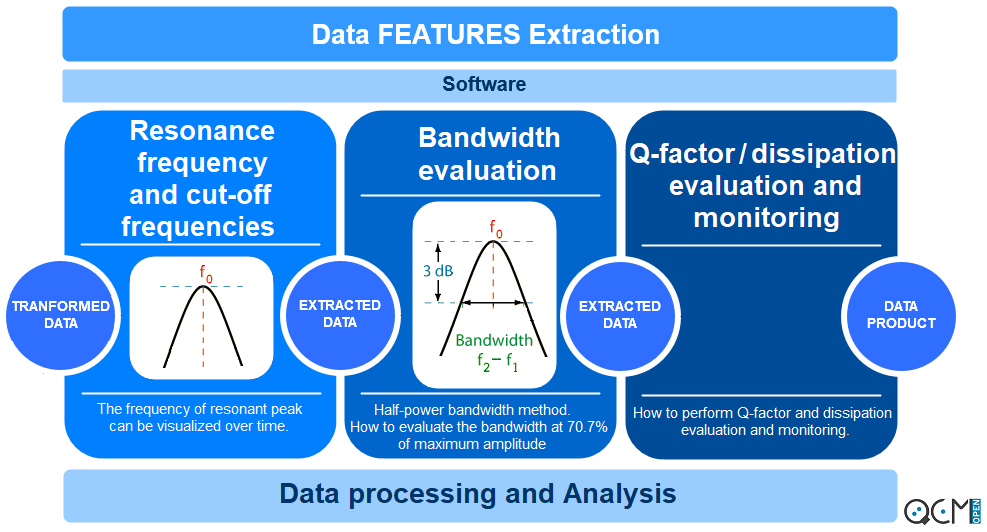
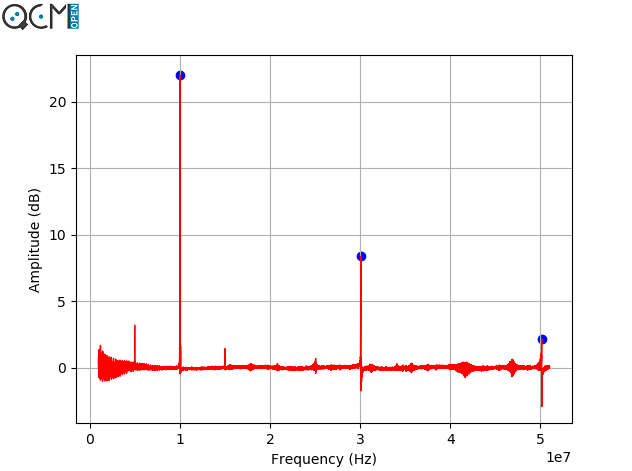
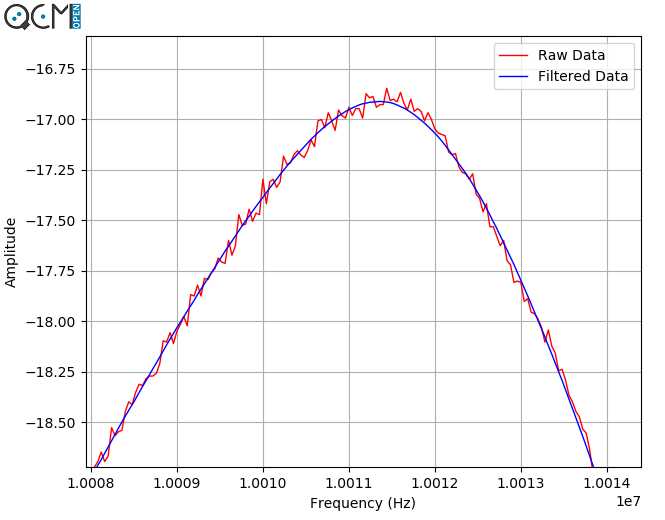
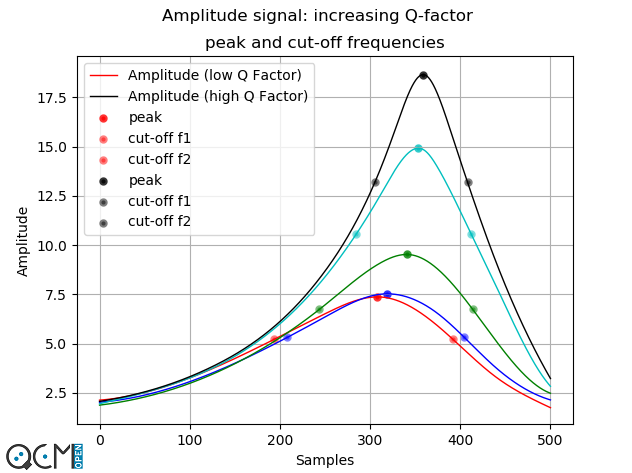
Data processing and analysis also include Data filtering and Data oversampling and subsequent extraction of desired features (Data features extraction): resonance frequency and amplitude, bandwidth and dissipation evaluation. Oversampling is used in order to improve the accuracy of peak level estimates for sampled signals. The results are then displayed in an appropriate window and, if necessary, can be stored (Results description).
In the following posts, each section of the previous diagram will be described. The algorithms for obtaining the results will also be presented and discussed.
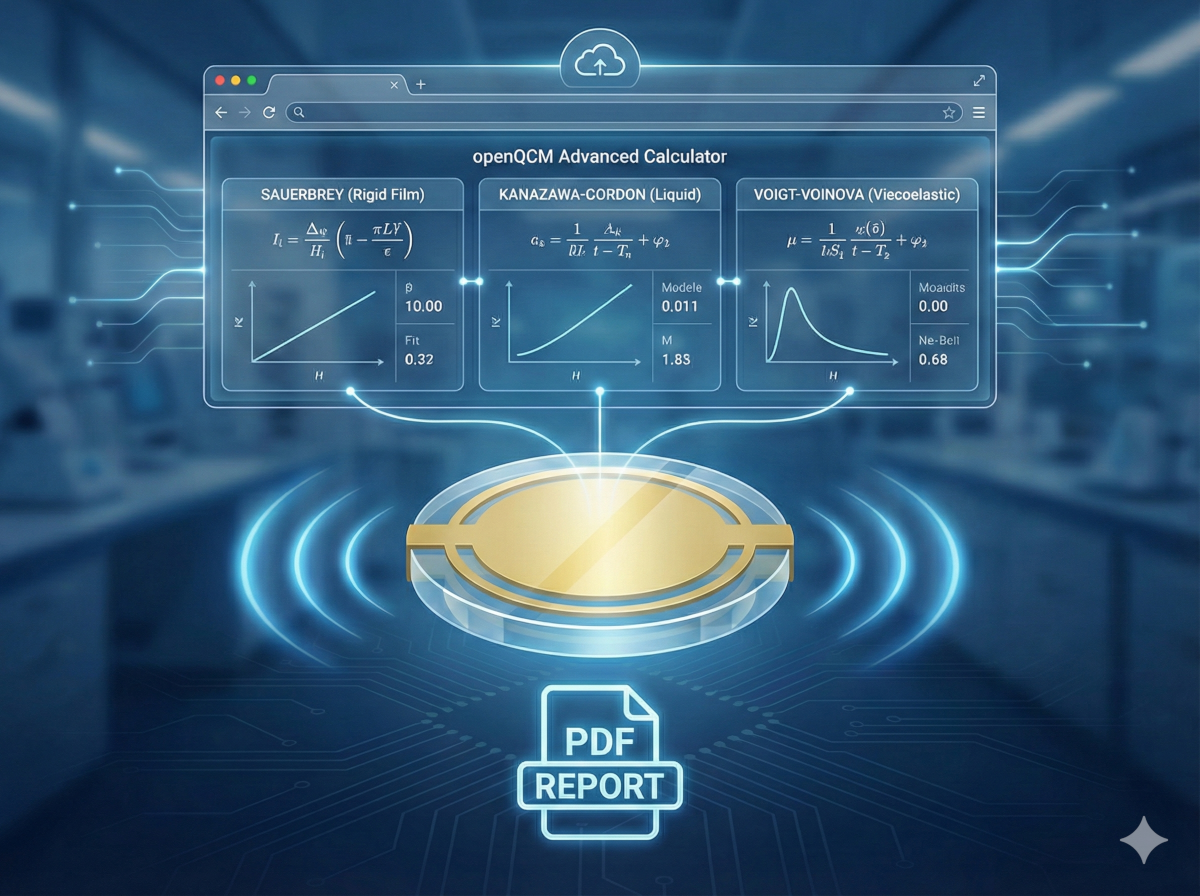
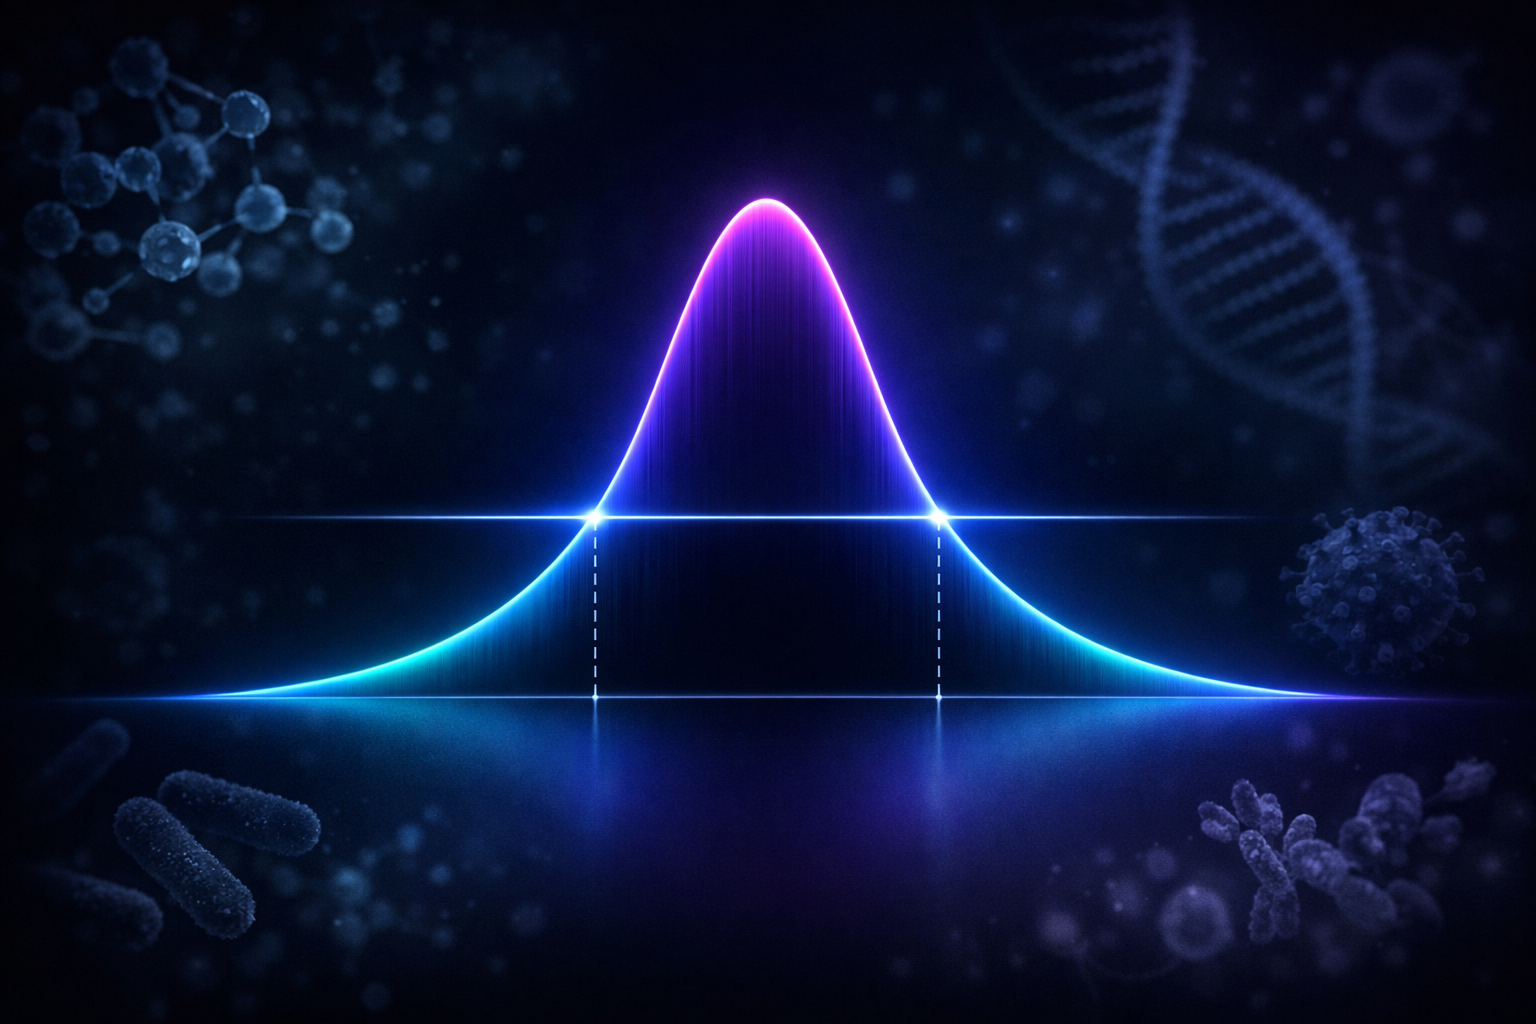
To get an idea of what we are discussing, you can see some examples in the following figures:
We chose to develop the new application for the openQCM Q-1 in the Python programming language because we believe that this language is suitable for the development of scientific applications and, at the same time, allows it to be easily improved and customized by the community.
In particular, the use of the multiprocessing Python Standard library allowed us to optimize the execution of simultaneous processes and also to drastically increase the sweep rate for the acquisition-processing of a resonance curve. In this way, we were able to obtain a simultaneous measurement of frequency and dissipation with a sampling time of less than one second.
The availability of a considerable number of software packages in Python language, together with their fast development by the scientific community, has allowed us to develop a post-processing algorithm based on data filtering and oversampling capable of improving the monitoring of the fundamental frequency and its overtones.
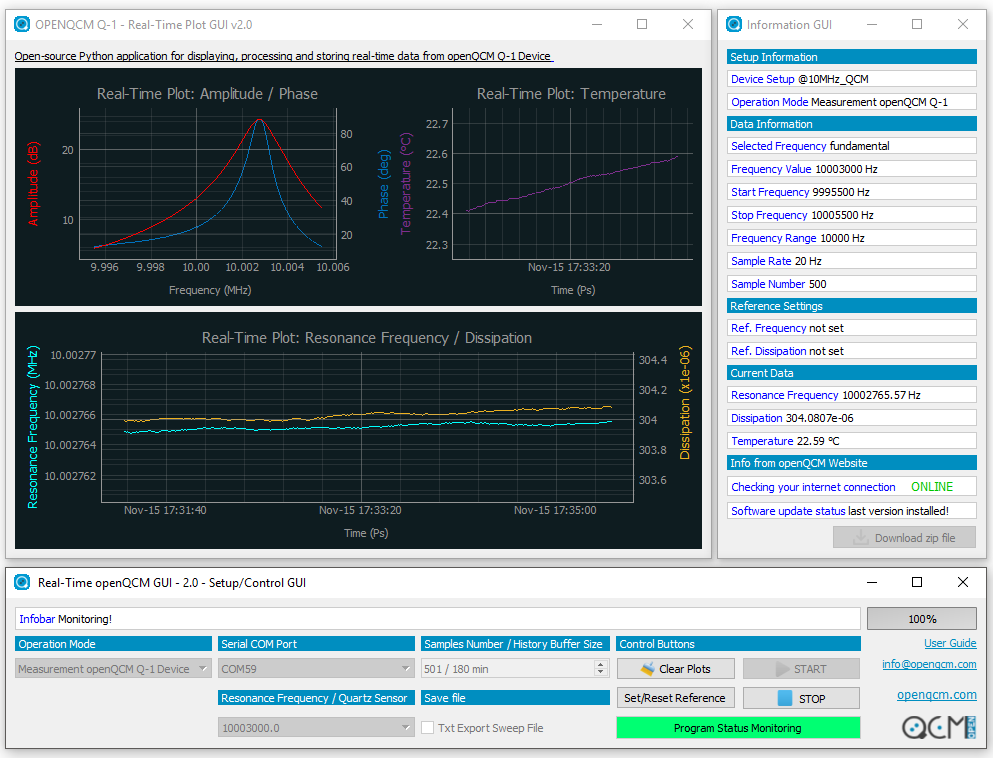
Here is the GUI of the new Python Software (V2.0) !