I will present the new Java software interface of openQCM the fully open source quartz crystal microbalance.
The first time we start the openQCM project we choose to develop the software in Java programming language. Although I was not very confident with Java programming at that time, this language appears to me very powerfull and suited for software development and implementation. Java applications have the unique feature of being cross-platform and running on many operating systems and hardware. Finally, Java is a free software released under the GNU General Public License !
When I started to programming the openQCM software my first goal was the development of the source code, whose main features were:
- Control and communication with the Arduino board
- Read and plot real-time data using a dynamic chart
These are very simple tasks for an experienced Java programmer, but it was a very hard work for me. The eureka moment came after some interesting discussion with Luciano Zu, the developer of Ardulink. Once I have discovered Ardulink the problems with Arduino communication using Java were solved.
My first openQCM Java software worked quite well, but the user interface looked like that:
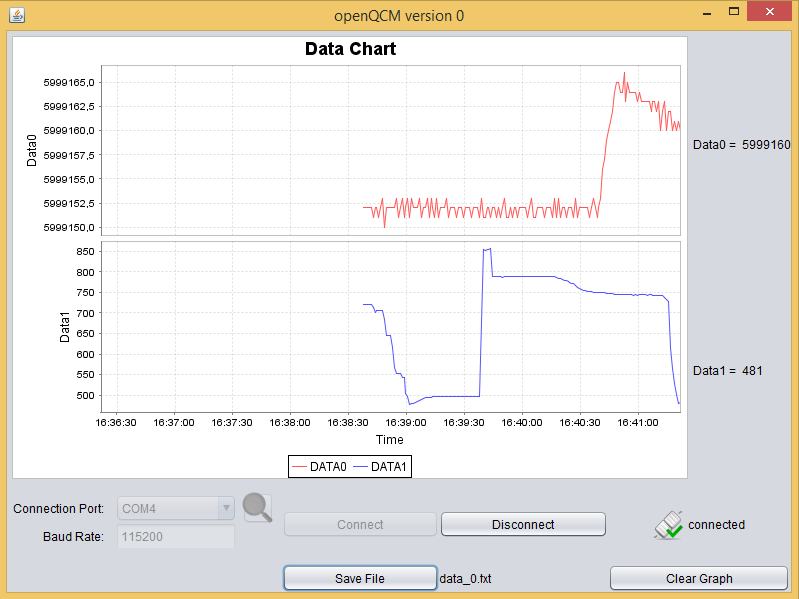
Not exactly a great work, what do you think ? When I asked Glenda Torres Guizado, the designer of openQCM hardware: “Glenda, what do you think about the software interface ?“, she told me: “uhm… I think we have to work on it !” I was agree, definitely.
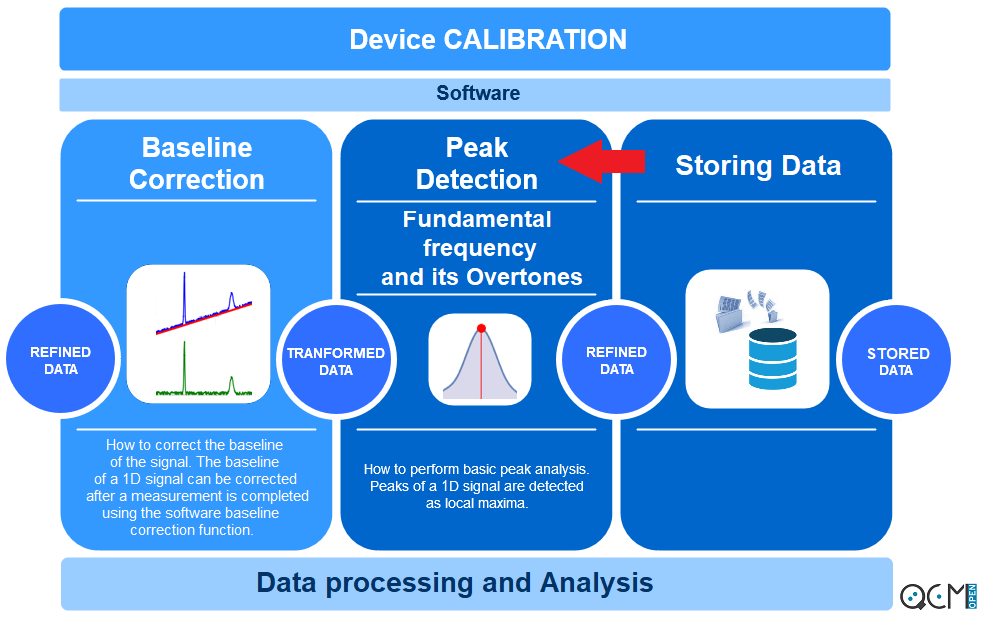
So, Glenda (the designer) and me (the programmer) have worked together to design the new simple, intuitive and efficient GUI (graphical user interface) of openQCM software. Glenda designed the interface concept, which looks like that:
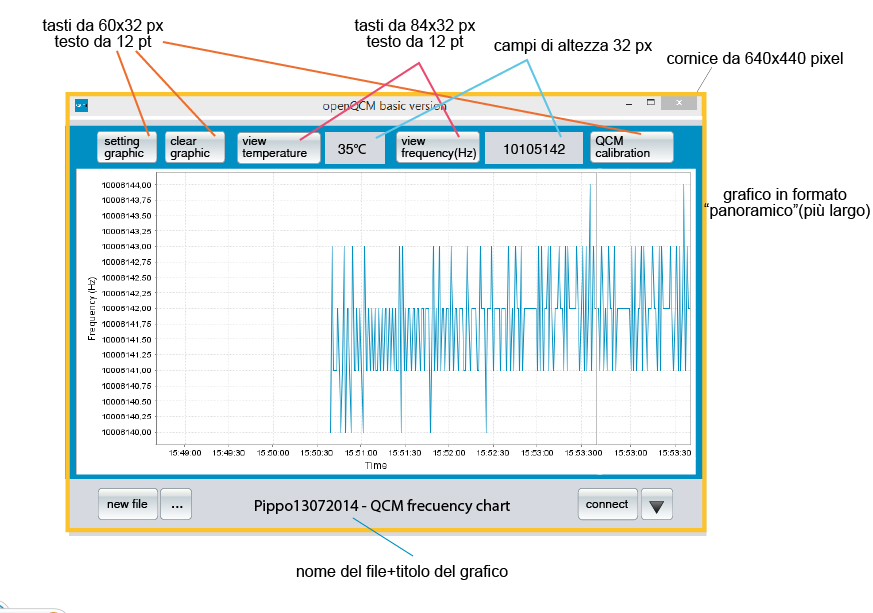
She highlighted the quartz crystal frequency dynamic chart, which is the most important part of the GUI software. Then, the interface concept shows two main panel: Bottom panel shows buttons for connection to the Arduino board and for save the data file; Top panel shows the displays for the current frequency and temperature data, plus buttons for chart settings. She also suggested to display the temperature data in the same chart using a secondary axis on the right, and to create a pop-up window for serial connection. “Great work, I like it” I thought, so I try to realize something similar to the Glenda’s concept.
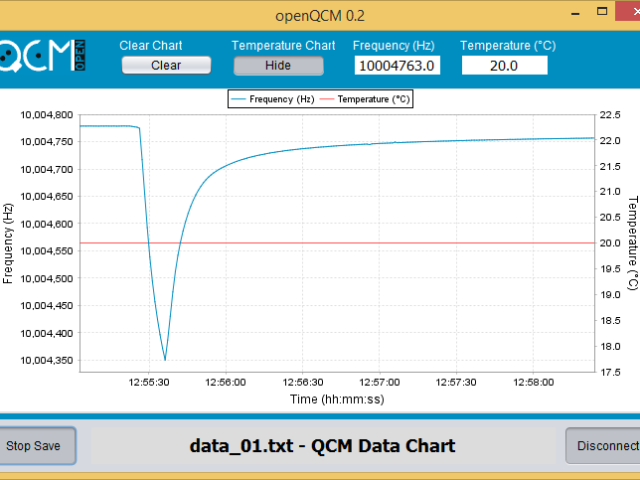
The (second) eureka moment came when I discover the Swing GUI builder in Netbeans IDE which is a great features for creating awesome GUI in Java programming language. Ardulink provides also java swing components collection, so I was on the right way definitely. The development of the new GUI encouraged me to write from the scratch the source code. My main achievement was the development of the swing component for the JfreeChart panel. I have all the right pieces of the puzzle and I have just to put them together in the right way. Finally, the new openQCM software interface looks now like that:
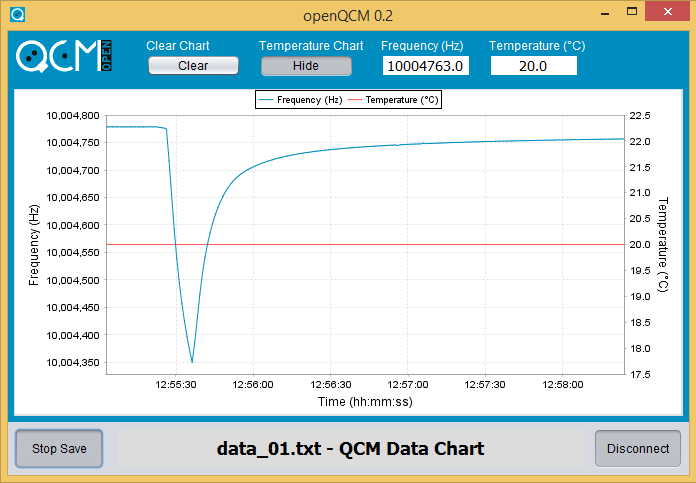
We are very happy for the final result, now it looks awesome. Am I right ? In these days I will post something more on the development of the new openQCM software, with more details both for developer and for user.
cheers
marco


